Desktop Survival Guide
by Graham Williams
|
|
DATA MINING
Desktop Survival Guide by Graham Williams |
|
|||
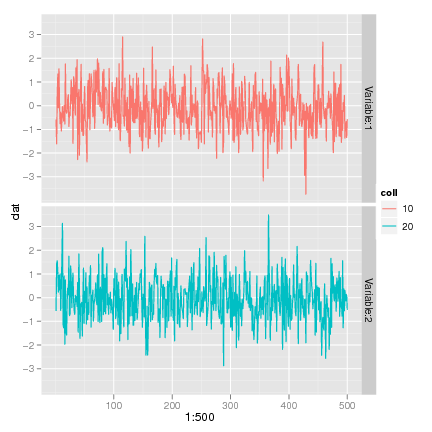
Multiple Plots Using ggplot2 |


|
> library(ggplot2)
> library(plyr)
> dat <- rnorm(1000)
> variable <- rep(c("Variable:1", "Variable:2"), each=500)
> coll <- rep(c("10", "20"), each=500)
> dat1 <- data.frame(dat, variable, coll)
> p <- ggplot(dat1) + geom_line(aes(y=dat, x=1:500, colour=coll),
                                group=variable) +  facet_grid(variable ~ .)
> print(p)
|