
Desktop Survival Guide
by Graham Williams
|
|
DATA MINING
Desktop Survival Guide by Graham Williams |
|
|||
Waterfall Plots |


|
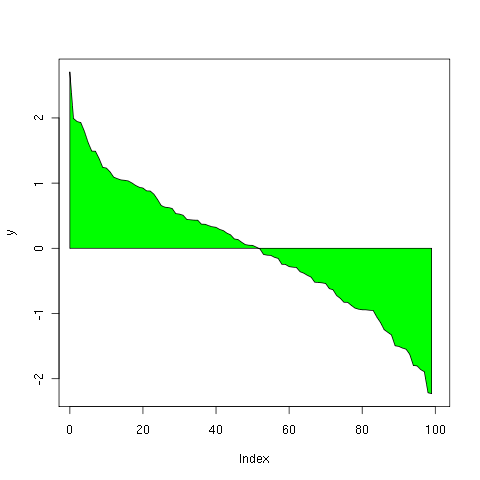
# From Thomas Petzoldt on r-help 31 Oct 2008
pdf("graphics/rplot-waterfall01.pdf")
# Sample data
x <- 0:99
y <- sort(rnorm(100), decreasing=TRUE)
# Plot
plot(y, type="n")
polygon(c(min(x), x, max(x), 0), c(0, y, 0, 0), col="green")
dev.off()
|
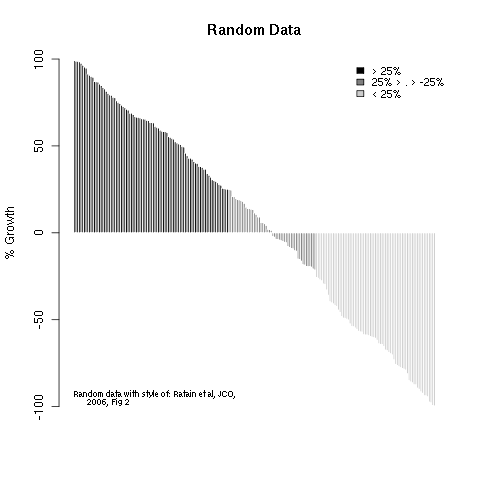
# From Gabor Grothendieck on r-help 1 Nov 2008
pdf("graphics/rplot-waterfall02.pdf")
growth <- sort(runif(215, -100, 100), decreasing = TRUE)
col <- factor(1 + (growth < -25) + (growth < 25),
              lab = c("black", "grey50", "grey80"))
barplot(growth, col = levels(col)[col], ylab = "% Growth",
        main = "Random Data", xlab = "", space = 0, border = 0,
        ylim = c(-100, 100))
legend("topright", legend = c("> 25%", "25% > . > -25%", "< 25%"),
       cex = 0.8, bty = "n", fill = levels(col))
legend("bottomleft", "Random data with style of: Ratain et al, JCO,
       2006, Fig 2", cex = 0.6, bty = "n")
dev.off()
|