Desktop Survival Guide
by Graham Williams
|
|
DATA MINING
Desktop Survival Guide by Graham Williams |
|
|||
Tutorial Example |


|
Our audit dataset can be used to provide a simple illustration of
building a random forest model. To follow this example, load the audit
dataset into Rattle using the Data tab
(See Section ![[*]](crossref.png) ), and select the appropriate input
variables using the Data tab
(See Section ) to identify Adjustment
as the Risk variable (figure ).
), and select the appropriate input
variables using the Data tab
(See Section ) to identify Adjustment
as the Risk variable (figure ).
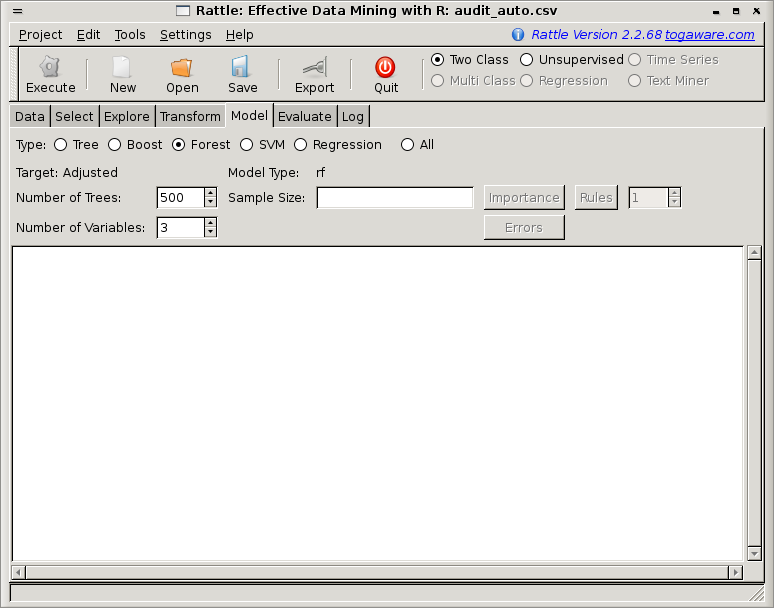
Now on the Model tab choose the Forest radio button as shown in Figure 13.1.
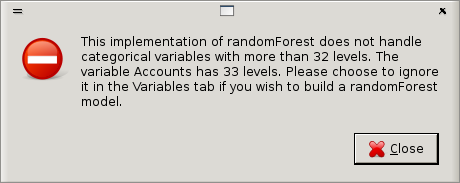
Click the Execute button to build the model. We will see a popup, as in Figure 13.2, explaining one of the limitations of this implementation of random forests. Underneath, Rattle simply employs the R package called randomForest (implemented by Andy Liaw) which in turn is based on the original Fortran code from the developers of the algorithm (Leo Breiman and Adele Cutler, who also own the Random Forests trademark and license it exclusively to Salford Systems). Thus some limitations are carried through to Rattle. This particular limitation is that categoric variables with more than 32 categories are not handled. Statistical concerns also suggest that categoric variables with more than 32 categories don't make a lot of sense.
As an aside, we also note that the Breiman-Cutler implementation of the random forest model builder as used in R appears to produce better results than those produced by the Weka implementation of random forest.
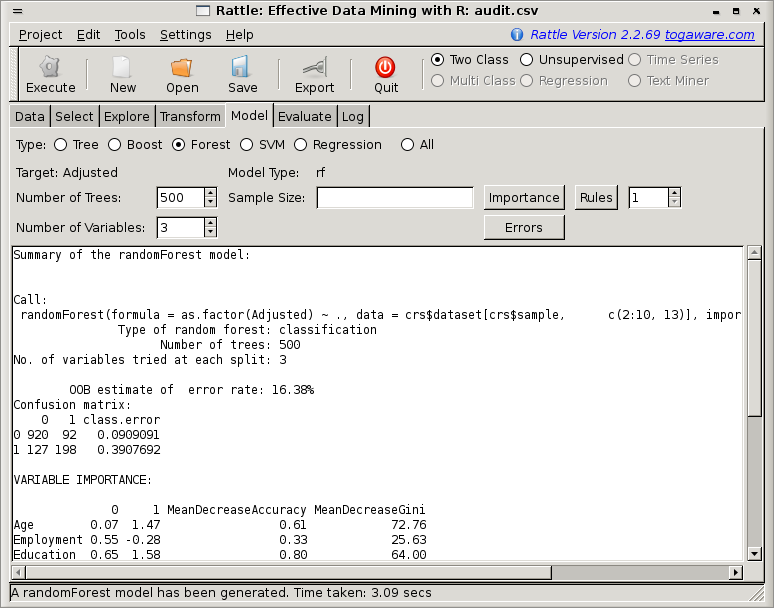
To rectify this problem with too many categoric values, the simplest approach is to change the role of the Accounts variable under the Data tab, to be one of Ignore, being sure to Execute the tab before coming back to the Model tab to build a the model. The model building takes about 3 seconds, and the results are displayed in the textview window of Rattle, as in Figure 13.3.
We can see that by default the summary begins with a review of the actual underlying R code that was executed. We need to scroll to the right in order to see the full command.
The next bit of text provides a summary of the model builder's parameters, indicating that a classification model was built, consisting of 500 decision trees, and 3 variables to choose from for each time we partition the dataset.
Next we see what is called an OOB estimate of error rate. OOB stands for ``out of bag.'' This estimate is regarded tøbe an unbiased estimate of the true error of the model. The idea is that in building any particular tree in the ensemble, we use a sample of the training dataset (technically this is called a bootstrap sample and is usually about two thirds of all the available data). The entities that are in the sample are said to be contained within the bag that is used to build the model. Thus those that are not being used to build the model are said to be out-of-bag. These out-of-bag entities are not used in building the model this time round, and hence can be used as a test dataset for this specific model. Any particular observation will be out-of-bag a reasonable number of times, and so we can obtain the proportion of times this observation is correctly classified and so obtain the estimates of performance for the whole model, which is what is reported by the model builder.
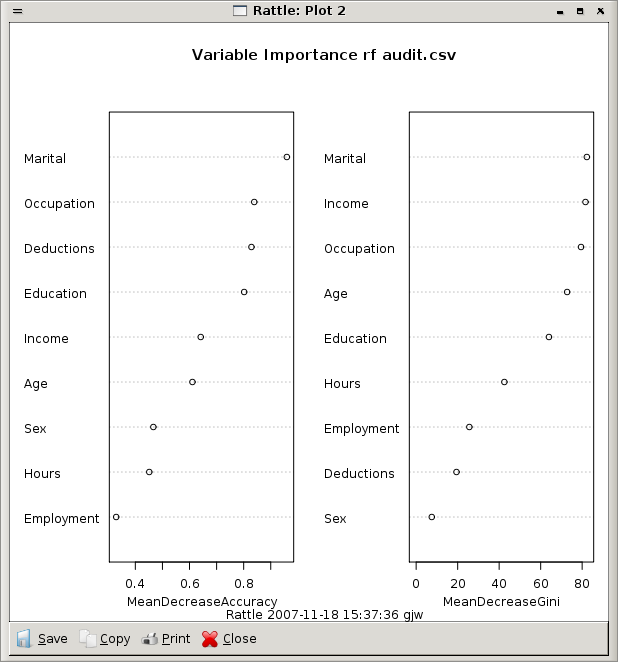
The Importance button allows us to graphically view the random forest's perspective on which variables are important in determining the value of the output variable. The plot (Figure 13.4) shows the two different measures of variable importance. The first importance is the scaled average of the prediction accuracy of each variable, and the second is the total decrease in node impurities splitting on the variable over all trees, using the Gini index.
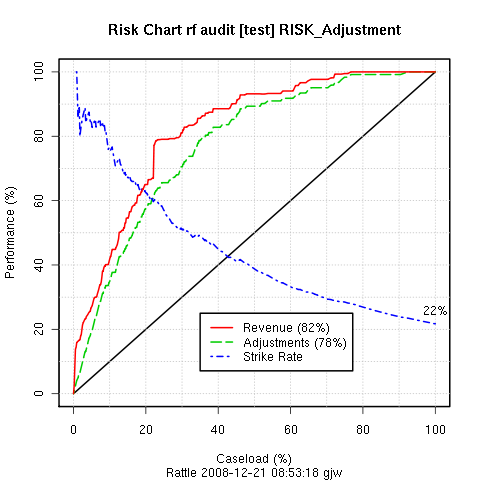
Moving on to the Evaluate tab, selecting the Risk radio button, and clicking the Execute button will generate the risk chart for this model, using the Adjustment variable as the measure of the size of the actual risk associated with those cases that required adjustments. The risk chart, Figure 13.5, indicates that we have a reasonable model.
For deployment, as a data miner we can put forward a case for using this model to score our population, and to then only have our auditors review perhaps 70% of the current number of cases. Thus, we would be saving our effort on the remaining 30% where we only recover less than 2% of the actual risk, and 5% of the actual cases that needed adjustment. This is quite a powerful argument for business, and a saving of even 10% is often worth the effort.
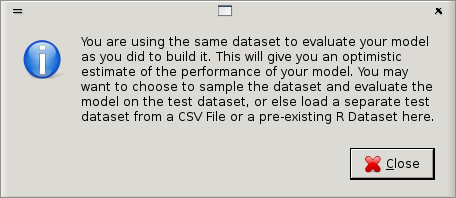
In Rattle the default for the Evaluate tab is to use the testing dataset to show a reasonable estimate of the true performance of the model. It is informative, though to display the performance on the training set. In fact, building a random forest and evaluating it on training dataset gives a ``prefect'' result. For other models this would tend to tell us that our model has overfit the training data. However, the performance on the testing dataset indicates that we have a generally good model. See Section 26.2 for a discussion of overfitting.
Do note though that when applying the model to the training dataset for evaluation, Rattle will popup a warning indicating that this is not such a good idea (Figure 13.6).
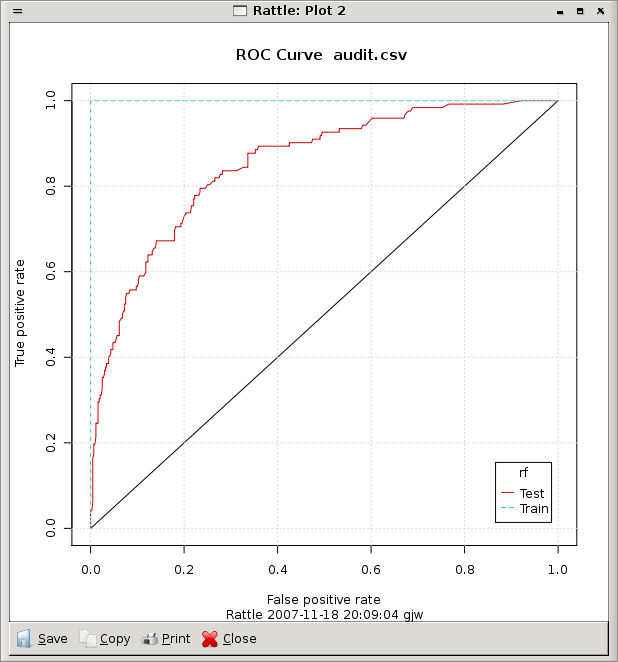
We can obtain a more traditional ROC chart (Figure 13.7) from the Evaluate tab.