Desktop Survival Guide
by Graham Williams
|
|
DATA MINING
Desktop Survival Guide by Graham Williams |
|
|||
|


|
Different model builders require different characteristics of the data
from which the models will be built. For example, when building a
clustering using any kind of distance measure, we may need to
normalise the data. Otherwise, a variable like Income will overwhelm a
variable like Age, when calculating distances. A distance of 10
``years'' may be more significant than a distance of $10,000, yet,
![]() swamps
swamps ![]() when they are added together, as would be the case
by calculating distances.
when they are added together, as would be the case
by calculating distances.
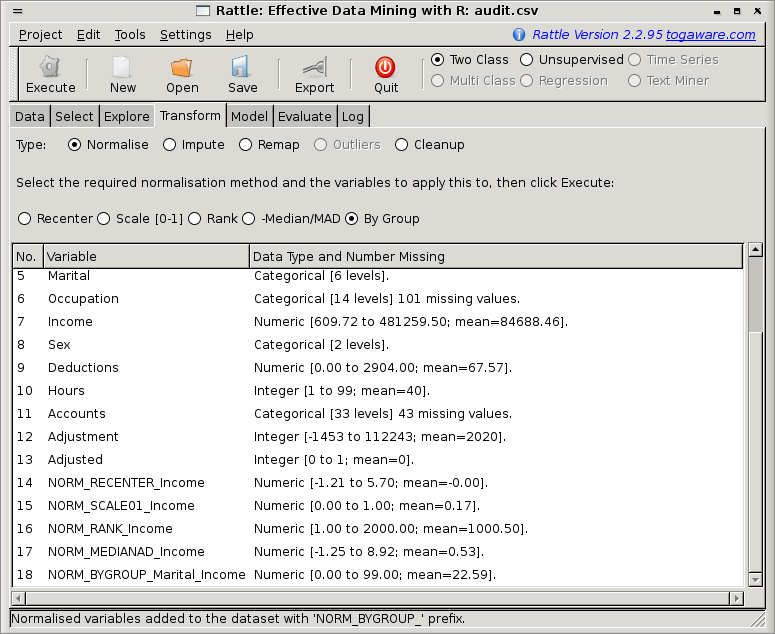
In these situations we will want to Normalise
our
data. The types of normalisations (available through the
Normalise option of the Transform tab) we may
want to perform include re-centering and rescaling our data to be
around zero (Recenter), rescaling our data to be in the
range from 0 to 1 (Scale [0,1]), covert the numbers into a
rank ordering (Rank), and finally, to do a robust rescaling
around zero using the median
(-Median/MAD). Figure ![[*]](crossref.png) displays the interface.
displays the interface.
We can see in Figure 23.2 the
approach we take to normalising (and to transforming) our data. The
original data is not modified. Instead, a new variable is created with
a prefix added to the variable's name that indicates the kind of
transformation. As we can see in the figure, the prefixes are
NORM_RECENTER_, NORM_SCALE01_, NORM_RANK_, and
NORM_MEDIANAD_.
We can see the effect of the four normalisations in comparing the
histogram of the variable, Age, in (REPLACE WITH INCOME?)
Figure , with the four
plots in Figure 23.4 for the
corresponding four normalisations.