
Desktop Survival Guide
by Graham Williams
|
|
DATA MINING
Desktop Survival Guide by Graham Williams |
|
|||
Probability Scale |


|
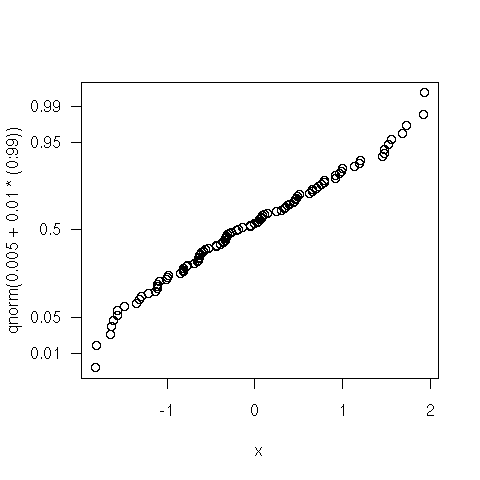
pdf("graphics/rplot-proby.pdf")
  x <- sort(rnorm(100))
  y <- 0.5+(0:99)
  p <- c(0.01, 0.05, 0.5, 0.95, 0.99)
  qqplot(x, qnorm(0.005+0.01*(0:99)), yaxt="n")
  axis(2, at=qnorm(p), label=p, las=1)
dev.off()
|