Desktop Survival Guide
by Graham Williams


|
DATA MINING
Desktop Survival Guide by Graham Williams |

|
|||
Other Examples |

# Based on code from demo(ROCR)
library(ROCR)
data(ROCR.hiv)
  pp <- ROCR.hiv$hiv.svm$predictions
  ll <- ROCR.hiv$hiv.svm$labels
  pred <- prediction(pp, ll)
  perf <- performance(pred, "tpr", "fpr")
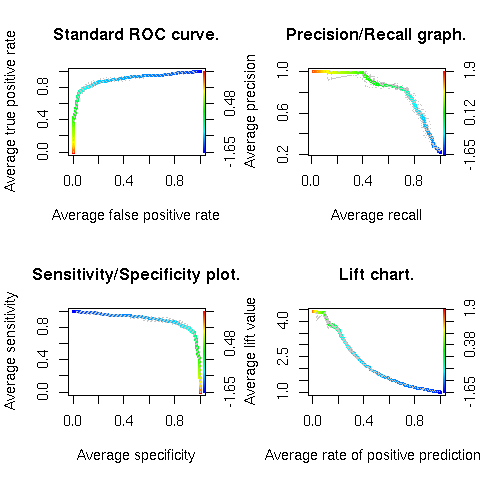
pdf("graphics/rplot-rocr-4plots.pdf")
  par(mfrow = c(2, 2))
  plot(perf, avg = "threshold", colorize = T, lwd = 3,
       main = "Standard ROC curve.")

  plot(perf, lty = 3, col = "grey78", add = T)
  perf <- performance(pred, "prec", "rec")
  plot(perf, avg = "threshold", colorize = T, lwd = 3,
       main = "Precision/Recall graph.")

  plot(perf, lty = 3, col = "grey78", add = T)
  perf <- performance(pred, "sens", "spec")
  plot(perf, avg = "threshold", colorize = T, lwd = 3,
       main = "Sensitivity/Specificity plot.")

  plot(perf, lty = 3, col = "grey78", add = T)
  perf <- performance(pred, "lift", "rpp")
  plot(perf, avg = "threshold", colorize = T, lwd = 3,
    main = "Lift chart.")

  plot(perf, lty = 3, col = "grey78", add = T)
dev.off()
|