
Desktop Survival Guide
by Graham Williams
|
|
DATA MINING
Desktop Survival Guide by Graham Williams |
|
|||
Multiple Time Series |


|
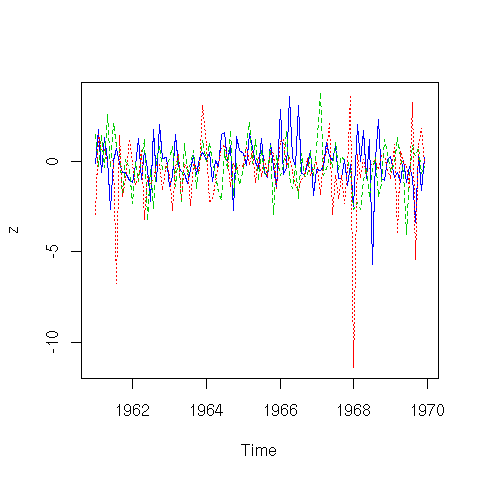
z <- ts(matrix(rt(200*8, df=3), 200, 8), start=c(1961,1), frequency=12) z <- window(z[, 1:3], end=c(1969, 12)) plot(z, plot.type="single", lty=1:3, col=4:2) |