Desktop Survival Guide
by Graham Williams
|
|
DATA MINING
Desktop Survival Guide by Graham Williams |
|
|||
Multiple Plots |


|
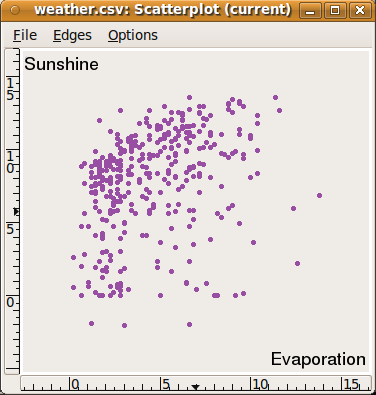
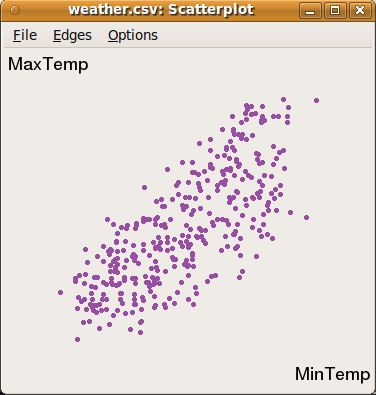
Any number of plots can be displayed simultaneously. From the Display menu we can choose a New Scatterplot Display to have two (or more) plots displayed at the one time, each in its own window. Figure 7.6 shows two scatterplots.
We can also do this from the R Console using the display function:
> display(gg[1], vars=list(X="Evaporation", Y="Sunshine")) |