
Desktop Survival Guide
by Graham Williams
|
|
DATA MINING
Desktop Survival Guide by Graham Williams |
|
|||
3D Plot |


|
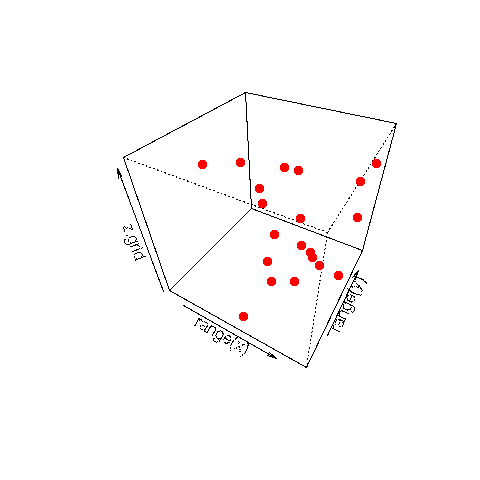
# Suggested by Robin Hankin
pdf("graphics/rplot-3dbox.pdf")
points3d <- function(x, y, z, jj.colour="black", ...)
{
  if(is.matrix(x))
    {
      z <- x[,3]
      y <- x[,2]
      x <- x[,1]
    }
  z.grid <- matrix(range(z), 2, 2)
  persp(range(x), range(y), z.grid,
        col=NA, border=NA, ...) -> res
  trans3d <- function(x,y,z, pmat)
  {
    tr <- cbind(x,y,z,1) %*% pmat
    list(x = tr[,1]/tr[,4], y= tr[,2]/tr[,4])
  }
  points(trans3d(x,y,z,pm=res), col=jj.colour, ...)
}
O <- matrix(rnorm(60), 20, 3)
options(warn=-1) # Ignore two warnings from the following.
points3d(O, jj.colour="red", pch=16, theta=30, phi=40)
dev.off()
|