
Desktop Survival Guide
by Graham Williams
|
|
DATA MINING
Desktop Survival Guide by Graham Williams |
|
|||
Boxplot From ggplot |


|
The Rpackage[]ggplot also provide functionality to display boxplots. The Rfunction[]qplot function is a simple interface to generate one. Here we use the audit dataset to explore the distribution of Age against Education.
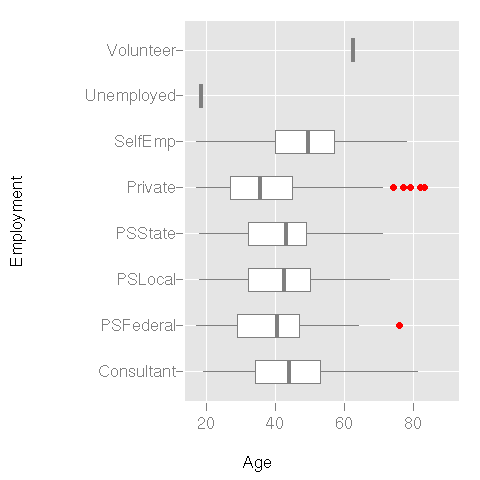
library(rattle) data(audit) attach(audit) |