
Desktop Survival Guide
by Graham Williams
|
|
DATA MINING
Desktop Survival Guide by Graham Williams |
|
|||
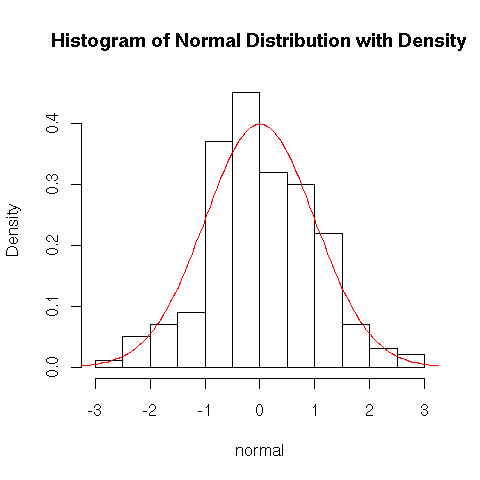
Basic Histogram with Density Curve |


|
R allows plots to be built up--this example shows a density
histogram of a set of random numbers extracted from a normal
distribution with the density curve of the same normal distribution
also displayed. In the R code we build the histogram at first without
plotting it, so as to determine the y limits (![]() selects the
minimum and maximum values, while
selects the
minimum and maximum values, while ![]() is the list of density
values being plotted and
is the list of density
values being plotted and ![]() is the maximum possible value of
the density), since otherwise the curve might push up into the title!
is the maximum possible value of
the density), since otherwise the curve might push up into the title!
ds <- rnorm(200)
pdf("graphics/rplot-hist-density.pdf")
  par(xpd=T)
  h <- hist(ds, plot=F)
  ylim <- range(0, h$density, dnorm(0))
  hist(ds, xlab="normal", ylim=ylim, freq=F,
       main="Histogram of Normal Distribution with Density")
  curve(dnorm, col=2, add=T)
dev.off()
|