
Desktop Survival Guide
by Graham Williams
|
|
DATA MINING
Desktop Survival Guide by Graham Williams |
|
|||
Basic Clustering |


|
We illustrate very simple clustering through a complete example where
the task is to read data from a file (See Section 30.3.4),
extract the numeric fields, and then use k-means
(See Chapter ![[*]](crossref.png) ) to cluster on just two columns. A plot of
the clusters over the two columns shows the points and the cluster
centroids. Normally, the clusters would be built over more than just
two columns. Also note that each time the code is run a different
clustering is likely to be generated!
) to cluster on just two columns. A plot of
the clusters over the two columns shows the points and the cluster
centroids. Normally, the clusters would be built over more than just
two columns. Also note that each time the code is run a different
clustering is likely to be generated!
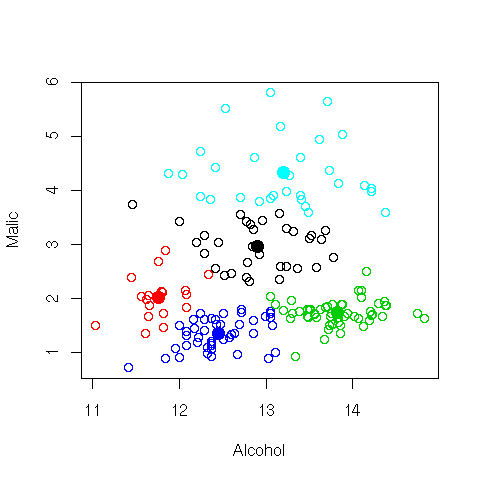
clusters <- 5
load("wine.Rdata")
pdf("graphics/rplot-cluster.pdf")
  wine.cl = kmeans(wine[,2:3], clusters)
  plot(wine[,2:3], col=wine.cl$cluster)
  points(wine.cl$centers, pch=19, cex=1.5, col=1:clusters)
dev.off()
|
The resulting cluster entity has the following
entries:
| cluster: | The cluster that each row belongs to. |
| centers: | The medoid of each cluster. |
| withinss: | The within cluster sum of squares. |
| size: | The size of each cluster. |