
Desktop Survival Guide
by Graham Williams
|
|
DATA MINING
Desktop Survival Guide by Graham Williams |
|
|||
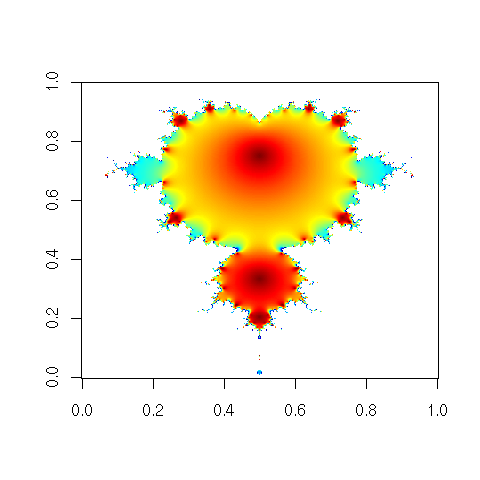
Animated Mandelbrot |


|
The following example, suggested by Jaroslaw Tuszynski (author of the
caTools
package), illustrates the use of complex numbers
constructed using complex, as well as the writing of
multiple images to a gif file to construct an animated
gif. Some 160,000 (400 by 400) complex numbers are generated
and stored in a matrix. A list of 20 arrays is then built, each being
400 by 400. The magic is then done in the for loop, 20 times, to
generate 20 images. All images are written to a single gif
file using write.gif. The final image (X[,,k])
is also displayed using image. We use
tim.colors from fields
to select a pleasing
rainbow colour sequence, but replace the first with
transparent to achieve a clear background.
library(fields)  # for tim.colors
library(caTools) # for write.gif
m <- 400          # grid size
C <- complex(real=rep(seq(-1.8,0.6, length.out=m), each=m),
             imag=rep(seq(-1.2,1.2, length.out=m), m))
C <- matrix(C, m, m)
Z <- 0
X <- array(0, c(m, m, 20))
for (k in 1:20)
{
  Z <- Z^2+C
  X[,,k] <- exp(-abs(Z))
}
col <- tim.colors(256)
col[1] <- "transparent"
write.gif(X, "graphics/rplot-mandelbrot.gif", col=col, delay=100)
image(X[,,k], col=col) # show final image in R
|