
Desktop Survival Guide
by Graham Williams
|
|
DATA MINING
Desktop Survival Guide by Graham Williams |
|
|||
Aligned Plots |


|
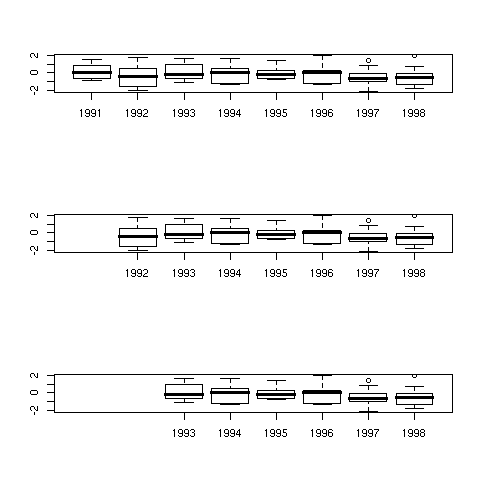
The next example illustrates how to make use of information in the Roption[]usr parameter (the x and y extent of the current plot) to align columns in three separate plots. Here we create some random data and arrange it into a data frame for 8 years of observations. Using the Roption[]mfrow option we indicate that we want 3 rows and 1 column of plots. We plot the first boxplot and save the value of Roption[]usr. A new plot canvas is created and it's Roption[]usr values is set to the same as the first plot so that we can specify locations to place the following plots (using Roption[]at). We also illustrate the use of the subset function.
dat <- rnorm(80)
years <- rep(1991:1998, each=10)
ds <- cbind(dat, years)
par(mfrow=c(3, 1))
boxplot(dat ~ years, ds)
usr <- par("usr")
plot.new()
par(usr=usr)
boxplot(dat ~ years, subset(ds, years %in% 1992:1998), at=2:8, add=TRUE)
plot.new()
par(usr=usr)
boxplot(dat ~ years, subset(ds, years %in% 1993:1998), at=3:8, add=TRUE)
|